Note: This page contains affiliate links for certain services and products. I may receive compensation at no additional cost to you when you click on these links.
With interest rates falling to close to all-time lows, investors have been looking to dividend stocks to make up for falling income. So are there any bargains to be had among dividend stocks? I used the finviz.com screener tool to look for bargain dividend stocks. You can find out more information about finviz.com and its screener tool in this post.
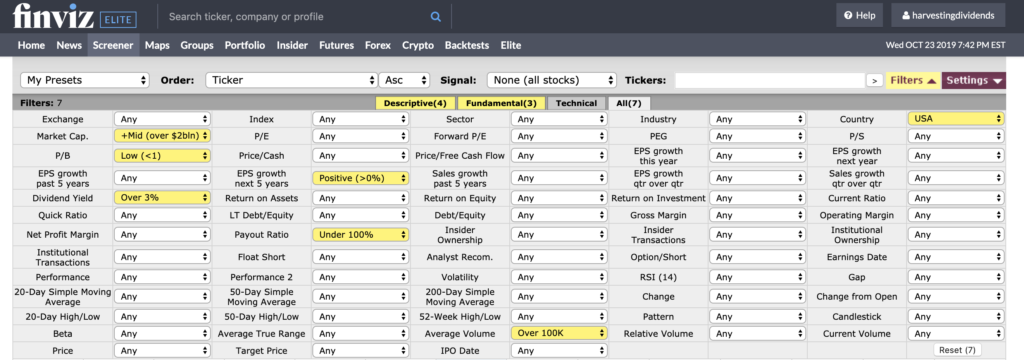
I screened for dividend stocks with the following characteristics:
- Price-to-Book ratio below 1,
- Dividend Yield of at least 3%,
- Market Capitalization above $2 billion,
- Positive EPS growth expected over the next 5 years,
- Payout ratio below 100%, and
- Average trading volume above 100,000 shares/day
This gave me a group of stocks that paid dividends that they could support (payout ratio below 100%), with the potential for further dividend growth (positive EPS growth expected), with decent liquidity (more than 100K shares traded per day, on average).
Once set up, the screener page looked like this:

Here are the results of the screen:
Low Price-Book Ratio Dividend Stocks
| Ticker | Company | Sector | Industry | Market Cap ($M) | P/E | P/B | P/Cash | Dividend Yield | EPS growth next 5 years | LT Debt/Equity | Total Debt/Equity | Price | Volume |
|---|---|---|---|---|---|---|---|---|---|---|---|---|---|
| ASB | Associated Banc-Corp | Financial | Regional - Midwest Banks | 3311.23 | 10.92 | 0.92 | 4.27 | 3.29% | 6.00% | 0.22 | 0.22 | 20.65 | 1048242 |
| CFG | Citizens Financial Group, Inc. | Financial | Regional - Mid-Atlantic Banks | 16484.38 | 9.79 | 0.79 | 3.43 | 4.00% | 6.59% | 0.55 | 0.55 | 35.98 | 4047540 |
| CIT | CIT Group Inc. | Financial | Credit Services | 4227.95 | 10.33 | 0.77 | 1.68 | 3.15% | 10.00% | 0.79 | 0.79 | 44.5 | 762080 |
| DXC | DXC Technology Company | Technology | Information Technology Services | 7734.51 | 7.1 | 0.68 | 4.14 | 3.00% | 6.69% | 0.72 | 0.86 | 27.98 | 2351644 |
| FNB | F.N.B. Corporation | Financial | Regional - Southeast Banks | 4003.2 | 10.26 | 0.85 | 6.18 | 3.94% | 10.00% | 0.09 | 0.54 | 12.17 | 2338033 |
| GT | The Goodyear Tire & Rubber Company | Consumer Goods | Rubber & Plastics | 3665.21 | 8.1 | 0.75 | 4 | 4.08% | 2.41% | 1.19 | 1.39 | 15.67 | 3409925 |
| IVZ | Invesco Ltd. | Financial | Asset Management | 7985.26 | 11.74 | 0.75 | 6.66 | 7.18% | 2.36% | 0.73 | 0.73 | 17.28 | 9387181 |
| MET | MetLife, Inc. | Financial | Life Insurance | 43402.75 | 7.65 | 0.69 | 2.35 | 3.78% | 6.59% | 0.26 | 0.26 | 46.55 | 3068007 |
| NAVI | Navient Corporation | Financial | Credit Services | 3014.24 | 7.2 | 0.92 | 1.73 | 4.95% | 12.00% | 26.29 | 28.34 | 12.94 | 2551393 |
| OZK | Bank OZK | Financial | Regional - Southeast Banks | 3762.49 | 9.41 | 0.97 | 3.34% | 12.00% | 0.14 | 0.14 | 29.98 | 766073 | |
| PACW | PacWest Bancorp | Financial | Regional - Pacific Banks | 4356.17 | 9.68 | 0.91 | 6.64 | 6.44% | 10.00% | 0.09 | 0.09 | 37.28 | 551146 |
| PBCT | People's United Financial, Inc. | Financial | Savings & Loans | 6475.82 | 13.27 | 0.97 | 6 | 4.19% | 13.73% | 0.13 | 0.13 | 16.94 | 3078413 |
| PRU | Prudential Financial, Inc. | Financial | Life Insurance | 37113.32 | 9.62 | 0.6 | 2.41 | 4.37% | 7.85% | 0.29 | 0.35 | 91.57 | 1754487 |
| TCF | TCF Financial Corporation | Financial | Regional - Midwest Banks | 5809.55 | 10 | 0.92 | 9.8 | 3.12% | 9.00% | 0.01 | 0.01 | 37.83 | 475302 |
| UMPQ | Umpqua Holdings Corporation | Financial | Regional - Pacific Banks | 3549.18 | 10.2 | 0.85 | 2.75 | 5.18% | 10.00% | 0.28 | 0.28 | 16.21 | 828231 |
| UNM | Unum Group | Financial | Accident & Health Insurance | 6177.99 | 11.77 | 0.65 | 101.61 | 3.89% | 5.92% | 0.35 | 0 | 29.27 | 1106058 |
A couple of thoughts:
- The financial industry, and specifically regional mid-sized banks, are overwhelmingly represented in the screen.
- At least two of these companies, PBCT and OZK, have grown dividends over an extended period of time. In the case of PBCT, they’ve grown dividends in each of the last 27 years. In OZK’s case, they’ve grown dividends in each quarter over the last decade.
- Several of these companies have very little debt. The LTDebt/Eq and Debt/Eq columns show the ratio of long-term debt and total debt to the companies’ equity, respectively. Notably, regional banks PacWest Bancorp and TCF Financial Corporation have debt-to-equity ratios below 10% each.
You can sort on any column in the table by clicking on the triangles next to each column header.
Hopefully, this screening tool gives you some ideas for further research. As always, do your due diligence before investing your hard-earned money. If you want to see the results if you adjust the screen, you can create your own at finviz.com.